delafields.github.io
The EPL’s modern transfer market
There’s a lot to say about the soccer/football’s current transfer market. One indisputable point? Transfer prices have blown through the roof. Let’s check the numbers.
To get data around transfers, I forked @ewenme’s awesome repo which contains transfer data scraped from Transfermarkt. For season-end results tables, I scraped Wikipedia.
Note, both sets of data range from the 1992-93 season to the 2018-19 season.
- 1992-93 because that’s the year the league was formally branded as the EPL
- 2018-19 because that’s the last complete year at the time of writing
All data can be found in my epl-transfers repo.
Here’s the kind of stuff you can quickly zip together with it:
How has league spending changed?
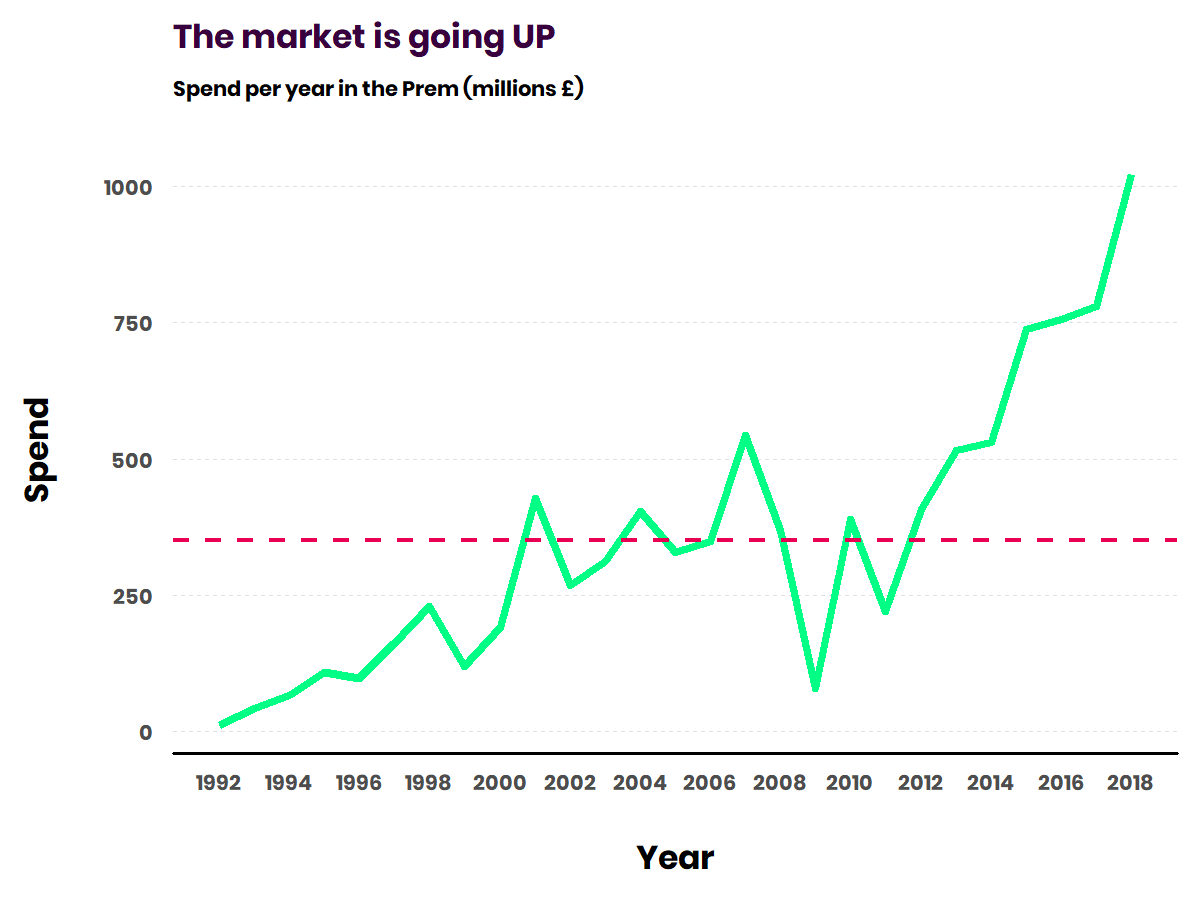
👆 those figures are all inflation adjusted too. It’s really neat to see the tangible drop from the 2008 financial market crash and the subsequent explosion in spending on transfers.
What positions is the money being spent on?
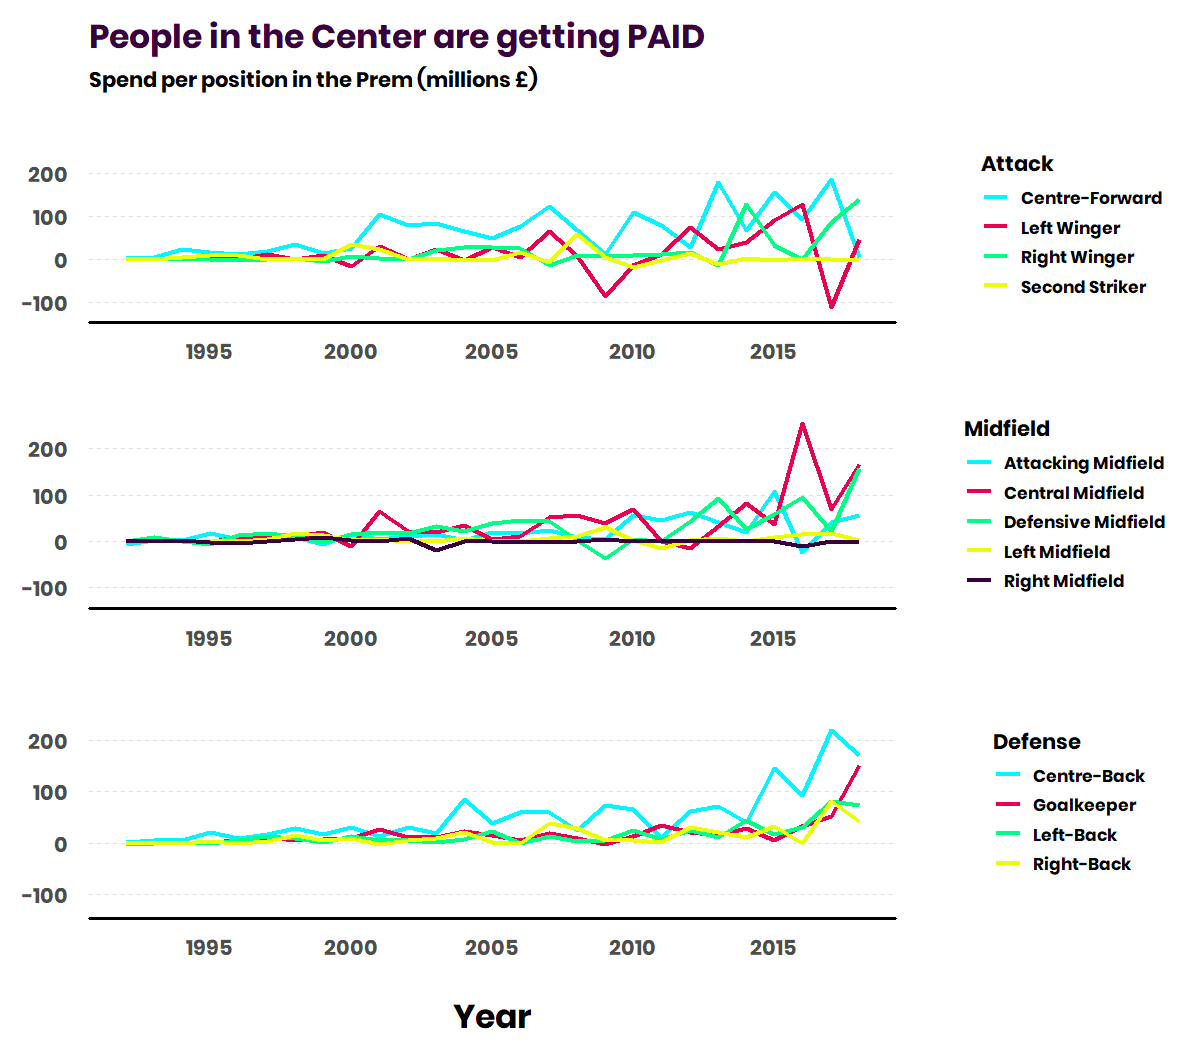
These are definitely spikey due to big transfer splashes but in the most technical terms - the spikes are getting bigger. It’s interesting to see the steady growth of the Centre-Back market which probably was probably proliferated by Liverpool’s signing of Virgil van Djik. Can you find who’s responsible for the huge spike in Central Midfielders in 2016?
Were they wise investments?
![]()
This was more of an exercise in plotting but this can be read as follows:
- The green circles represent ranks of amount spent, summed over 1992-2018. I chose not to average this due to pro/rel throwing the calculations off.
- The deep purple circles represent average position in the table.
City’s Avg Pos is a bit skewed due to their historical mid-table performance, combined their more recent spending under owner Sheikh Mansour. United, Liverpool, and Arsenal show real consistency in both spend and performance. Chelsea gets a bit less bang for their buck. Sunderland really hasn’t performed to the size of their pockets.
Not just buying and selling - what about loans?
I wouldn’t really expect there to be an equivalent spike in spend on loanees - that’s all intuition (might be something worth exploring though). What I looked into was how many loans were being conducted year-over-year.
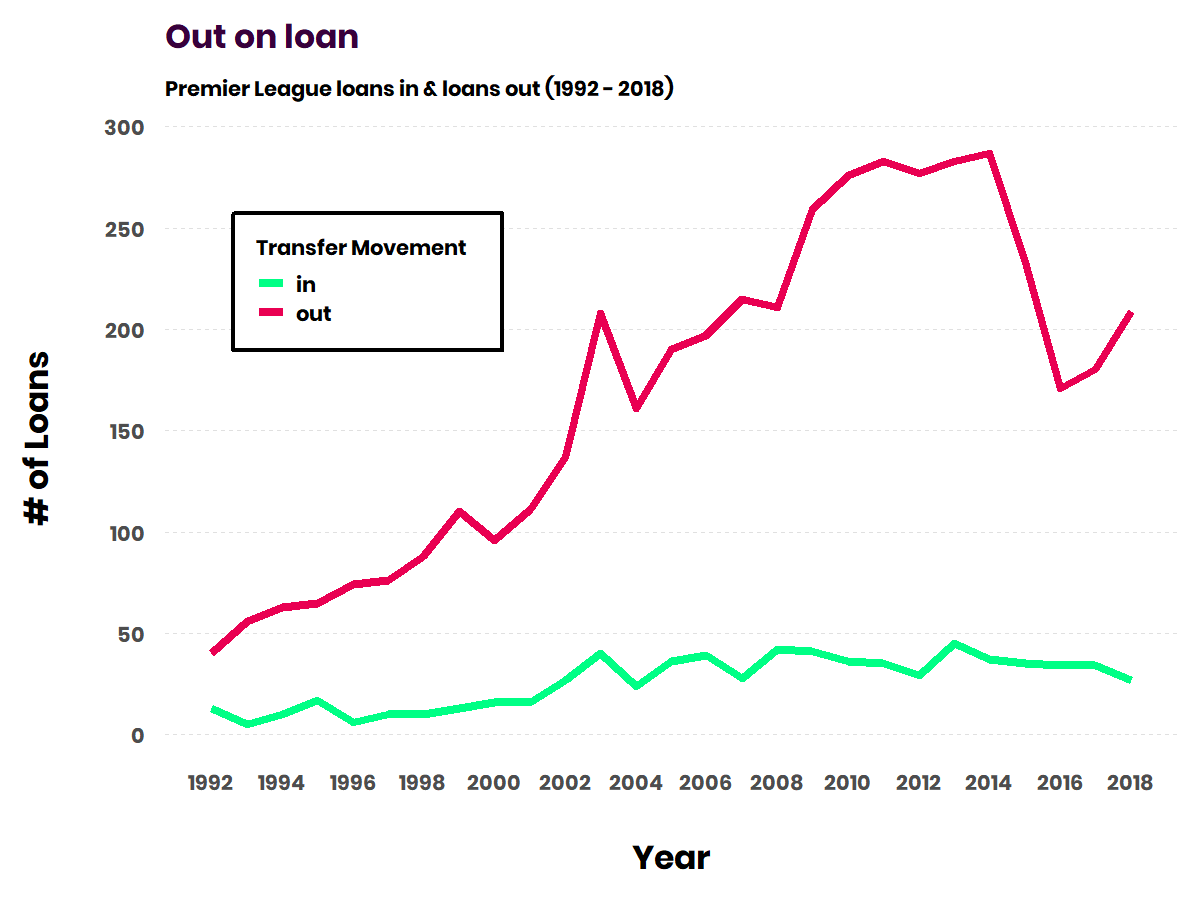
There is a clear increasing trend in Premier League teams loaning more players out every year, minus the drop from 2014 - 2016. I think the credit for this is due to one of two things
- The constantly improving youth academies in the league; with loans being a great way to develop young talent.
- With the explosion of transfer spend, loans become a way to offload players that haven’t worked out.
Who’s doing the loaning?
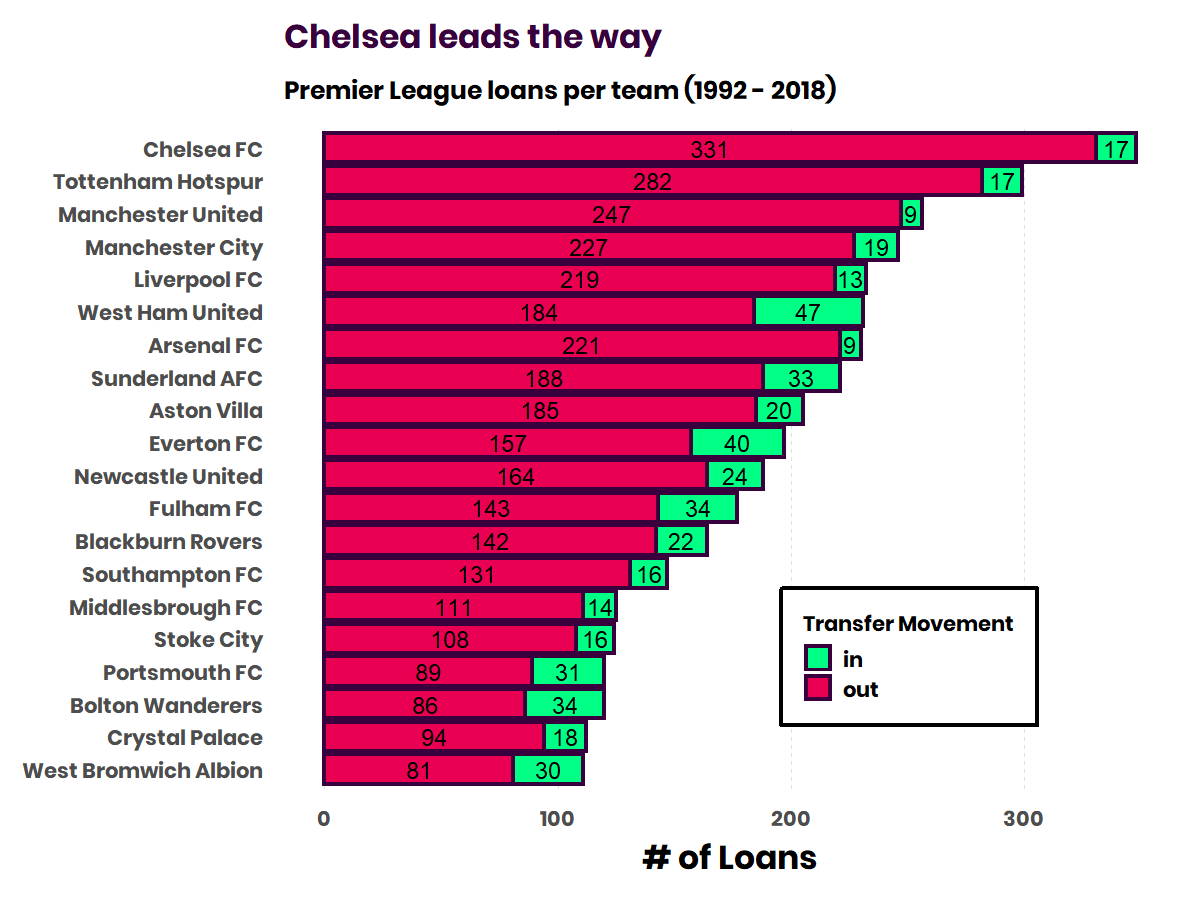

No surprise that Chelsea and the Big 6 are at the top of the loan out chart for the reasons I mentioned above.
For loans in, there are a fair number of middle/lower end of the table clubs (no offense) (but offense meant for Stoke). This is probably due to their inability to make huge transfer splashes.
Let me know if you put anything cool together with the data. There are a lot of nuanced ways you can cut this stuff. I’ll be following up with a post using the transfer data in combination with the results data to see who gets the most bang for their buck.